How Your Nonprofit Organization Can Use Salesforce Embedded Analytics
A great new way to boost your Salesforce analytic capabilities is here with Embedded Analytics from the winter 14’ release. Have you ever needed more insight in to an organization or individual’s overall involvement with your organization? Now you can have critical insights into your data from the record detail page.
Administrators can now add two report charts to custom and standard page layouts, giving a view from a report or filtered data from the record being viewed. In the new section of the page layout editor titled “Report Charts”, administrators can choose from up to 200 report charts to drag and drop on to new or existing sections of the page. The charts will be shown in the original format of the report it is coming from and will have full hover and click through capabilities.
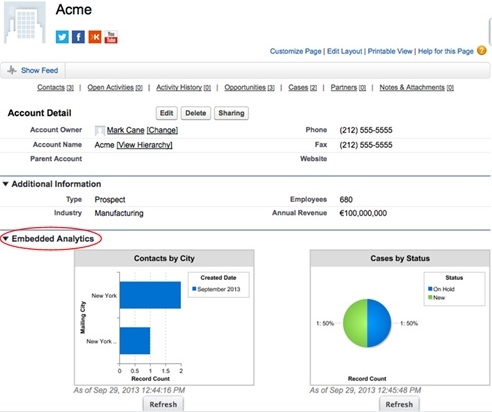
Because you can filter the reports based on record ID, you can pull reports from other objects and filter them to see only records pertaining to the record you are on. For example: A nonprofit organization might want to place a report on recurring donations onto the Organizations (Account) page. This way, they will be able to immediately see a trend in giving or if an organization has gone cold over the past year. Or a company may want to put a report on Case status on the Account page so they can see how quickly an important account’s cases are being resolved.
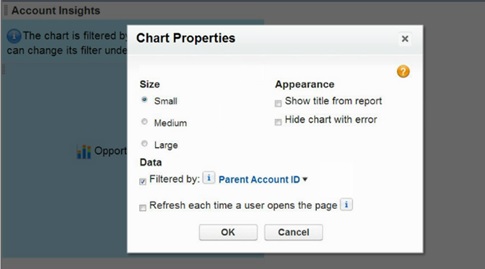
Charts will refresh every 24 hours automatically but users have the option to click the refresh button on the chart as needed. Additionally, administrators have the option of setting charts to refresh each time a user opens the page. One caveat is that refreshes are subject to hourly limits. Administrators should be cognizant of the reports they are placing on page layouts and the refresh options they chose. From a user standpoint, refreshing when the page opens can take longer for reports that take a long time to run.
Remember:
- Reports must be in matrix or summary format
- Report charts must already be on the original report
- Reports must be saved in a shared folder to be available for use
- Select a report that has the record ID field you would like to filter for the page or else you will view an unfiltered report
Overall, I think this is one of the most exciting new features to come out of the winter 14’ release. Once again, Salesforce has figured out a way of further streamlining a user’s process so they will only need to look at the record they are on to get valuable insight into its trends instead of navigating to the reports tab. This feature proves valuable for all types of businesses and organizations.
To learn more, please visit:
Salesforce Embedded Analytics Help
– Danielle Galiano is a Nonprofit Salesforce Consultant and Salesforce Certified Administrator & Developer with Acutedge Inc.